Date |
Feedback |
Status |
| 15 June 2026 |
I have checked the Privacy Policy boxes multiple times and nothing appears to happen so I am unable to check the Terms of Use box. Is there something else I'm supposed to do?
Answer: You need to check both boxes on the Privacy Policy and then check the box on the Terms of Use.
This works fine on every device and every browser we have tested.
If nothing happens when you try to check the boxes, the only explanation we can think of is that your browser must be blocking cookies and local storage.
Please check the privacy/security settings in your browser and make sure it isn't blocking cookies or local storage.
For example, in Chrome, you must check "Allow sites to save data on your device" in "chrome://settings/content/siteData".
This is checked by default, but it's possible it might have been unchecked at some point.
Hopefully you can get it working, but please submit another feedback with your email address if you need any further help.
Best regards, The ProVisualizer Team.
|
Check Browser Security Settings |
| 17 May 2026 |
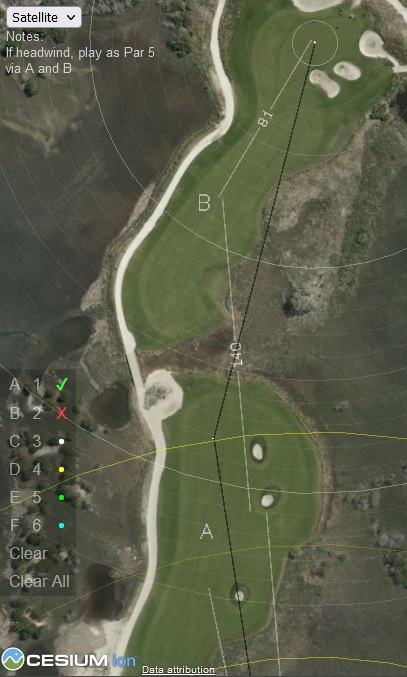
I was curious if there was a way to add a normal wind direction to any course layout. It would be great to be able to enter a wind direction and possible magnitude as this could play a major factor in determining total shot distance possible and how that might look on a hole into the wind vs with the wind.
Answer: To see the weather for the next 5 days, including the wind speed and direction, click the small "Weather..." option in the bottom left corner of the 2D/3D Planner.
This is described in more detail here.
Probably the best way to specify the normal wind direction would be to add a "Note" to the overview when "All" holes are selected.
Hope that's OK.
Best regards, The ProVisualizer Team.
|
Add Note to Overview |
| 10 May 2026 |
Could you please add green slopes and contours for Inverness Club in Toledo?
Answer: Unfortunately the freely available lidar data for Inverness Club was captured before the recent renovation and does not have the new bunkers and green complexes. We will check periodically and add the lidar data as soon as there is a new survey.
However, please note that it could be a long time, as the surveys are typically only repeated every 5-10 years.
Hope that's OK.
Best regards, The ProVisualizer Team.
|
Waiting for Survey |
| 23 Apr 2026 |
Wondering if there is lidar data for Sydney and if so could you please map the greens for The Australian GC?
Could you also do Royal Melbourne?
Answer: We added lidar data for The Australian. However, we couldn't find any freely available lidar data for Royal Melbourne.
We will check periodically and add lidar data for Royal Melbourne as soon as it becomes freely available.
Hope that's OK.
Best regards, The ProVisualizer Team.
|
Waiting for Survey |
| 8 Dec 2025 |
It seems like the map is not loading in the 2D/3D Planner. The earth just appears as a solid gray sphere.
Hope this is able to be fixed since I love using this tool. Thank you!
Answer: This can happen occasionally when there are too many users and we exceed our imagery quota. To try to prevent this happening in the future, we have put some measures in place to prevent excessive usage. In particular, please note that imagery will probably be denied if you try to use the site in a private/incognito tab, as such tabs do not cache imagery tiles and therefore consume far more imagery credits than normal tabs. Also, it will take at least 5 minutes for new users to build up some imagery credits. Therefore, please be patient if you are a new user.
Hopefully that's OK, but please let us know if you have any further issues.
Best regards, The ProVisualizer Team.
|
Complete |
| 25 Jul 2025 |
Please could you add green slopes and contours for Pinehurst?
Answer: We would love to do this but unfortunately the data that is currently available in the Pinehurst region isn't accurate enough for green slopes and contours. You can see the data by selecting "Lidar" in the drop-down in the top left corner of the 2D/3D Planner. Pinehurst is one of the few regions in the U.S. that hasn't yet been accurately surveyed, so hopefully we won't have to wait too much longer. We will add green slopes and contours as soon as the data becomes available.
Best regards, The ProVisualizer Team.
|
Waiting for Survey |
| 2 Jul 2025 |
It would be great to be able to save custom courses and profile to a file so it can survive browser data clears or computer re-installations.
Answer: To backup your profile and courses, go to My Profile and My Courses and follow the backup instructions. These are link-based backups rather than file-based, as links are much easier to work with for the majority of users. For example, you can copy and paste the links into an email and send it to yourself or a friend, then restore any profile/course to any device simply by opening the email and clicking the link.
Hope that's OK.
Best regards, The ProVisualizer Team.
|
Use Existing Backup Options |
| 8 Jun 2025 |
The RBC Canadian Open TPC Toronto course goes black. I've become very accustomed to watching with my ProVisualizer in hand. First time dissapointed.
Answer: The TPC Toronto course has recently been renovated and the default imagery was out-of-date so we patched in an up-to-date image of the course. The patched image was quite large (~10MB) as it needed to cover the whole course at high resolution. It works fine on laptops and other devices with good memory capacity, but it's possible the image is too big for some smaller devices. We only do this in very rare cases where there is no other way we can get up-to-date imagery, so hopefully you should be able to view the other PGA Tour courses no problem.
Hope that explains it.
Best regards, The ProVisualizer Team.
|
Image Too Large for Small Devices |
| 2 Jun 2025 |
I’m developing a mobile golf app and would like to ask if you provide access to your course data, either via API or bulk download.
Answer: We don't offer bulk download as obviously our course data is one of our biggest and most unique assets (it has taken over 10 years to build our database).
However, it's possible we could do some sort of integration where users of your app could load their personalized maps from ProVisualizer into your app.
If this would be of interest, please submit another message with your email address so we can contact you.
Best regards, The ProVisualizer Team.
|
More Details Required |
| 27 May 2025 |
The new Karsten. This replaced Karsten Creek. It's a really unique course with no par and no USGA rating. Really difficult to navigate. Adding this new course would be really helpful.
Answer: Thanks very much for reporting this. We will update our map as soon as the new imagery is available.
Best regards, The ProVisualizer Team.
|
Waiting for Imagery |
| 17 Jan 2025 |
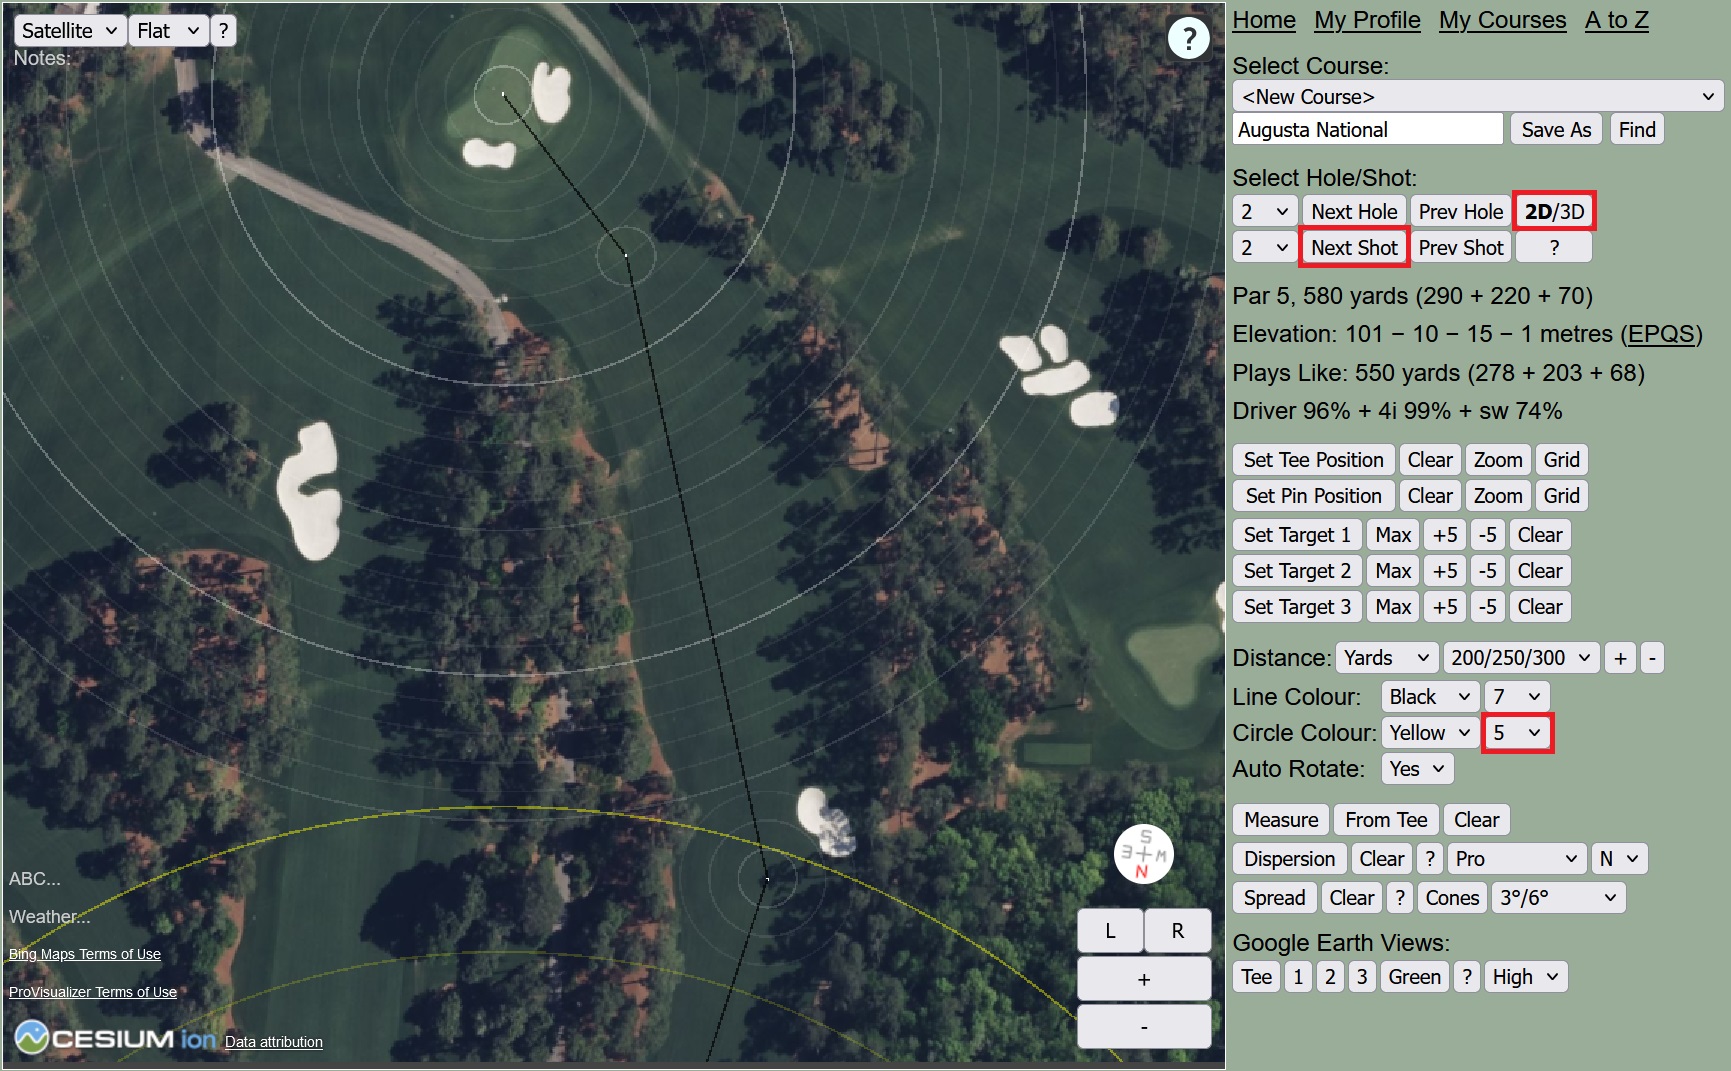
In the training videos for Mapping Tools it shows rings around your tee shot where each ring represents 10 yards away from target. That is very useful for quickly seeing how wide a target you have. I can't seem to find a way to show this on Chrome. Is this functionality still available, or has it been discontinued?
Answer: To see the circles around your targets in the 2D/3D Planner, you have to click the "Next Shot" button. This puts 10/20/30-yard circles around your tee shot target, plus a 10-yard circle around your lay-up target on par-5's. The behaviour should be the same in all browsers. Note that the circles are only displayed in "2D" mode, and you need to set the circle brightness high enough so the circles are visible against the background of your course.
Hope that helps.
Best regards, The ProVisualizer Team.
|
Click "Next Shot" in "2D" Mode |
| 4 Jan 2025 |
Hi would it be possible to map the greens for the Kau Sai Chau courses in Hong Kong? Thanks
Answer: Unfortunately, we can't generate green slopes and contours for those courses, as we don't currently have access to any high-resolution terrain data for that region. Currently, we only have high-resolution terrain data for the United States, England and Scotland, and even in those regions, the data can sometimes be too old or too inaccurate for green slopes and contours.
Hope that's OK.
Best regards, The ProVisualizer Team.
|
Not Possible |
| 4 Dec 2024 |
There has to be a better way devised of restoring courses that have been lost due to a google website malfuction that wipes all courses
from the My Courses page...being able to copy and paste over 100 mapped courses from pro viz to email as back up is fine but to have to
copy and paste the individual links back 1 by 1 is just not professional, sensible or sustainable...a bulk way of reinstating the entirity
of the back up that was sent to email needs to be found...thanks
Answer: We agree a bulk restore option would be good in principle. However, there were several reasons why we decided against it:
- URL length limitations mean it's not possible to do a bulk restore via a single link, so it would have to be a file-based backup and restore process, which would be more difficult for most users to manage.
- We don't think bulk restore is essential, as it only takes a few seconds to restore individual courses one-at-a-time when needed.
- To eliminate the need to search back through your emails each time you need to restore a course, you can copy the contents of the backup email to an online doc and bookmark the doc for easy access.
- Quite often, users will only want to restore a single course, and this is much easier with a link-based system than a bulk file-based system.
- The link-based system also provides a really easy way for people to share their courses with their friends.
Having said all that, in theory it would be possible to provide a bulk restore option where you could copy the link-based backup into a text box and it would decode the links to restore the courses all in one go. If you still think a bulk restore option is essential, please let us know and we will try to do this.
Best regards, The ProVisualizer Team.
|
Copy Email Backup to Online Doc and Bookmark for Easy Access |
| 27 Aug 2024 |
When I try to zoom in, using the scroll wheel on my mouse (just one scroll), it goes extremely close, to a point that I can't see anything and when I zoom out, it goes back out to the globe view. Not the end of the world, as the + and - still work but just a bit inconvenient when it never used to be like that. Thanks!
Answer: The recommended way to zoom using a mouse is "Right Click + Drag Up/Down". If you use the mouse scroll wheel, it could be equivalent to dragging the mouse a very long way, depending on your scroll wheel speed settings. Please try the "Right Click + Drag Up/Down" method. Hopefully that should work a lot better, but please let us know if it's still zooming too fast.
Best regards, The ProVisualizer Team.
|
Try Right Click + Drag Up/Down |
| 13 Aug 2024 |
Message saying "Error constructing Cesium Widget" appears on 2D Planner startup and cannot access courses.
Answer: We recently upgraded to the latest version of the Cesium graphics library.
This was an essential upgrade to ensure ProVisualizer works correctly on modern devices.
Unfortunately, it seems the latest version of Cesium uses some WebGL 2.0 functions that are not supported by some older devices, and this is probably the root cause of the error you are seeing.
Please go to the Cesium website and scroll down to the interactive example.
If you see the same error there, that would confirm that your device does not support the necessary WebGL functions.
On the other hand, if the interactive example on the Cesium website works correctly, please let us know your precise device, operating system and browser versions, and we will try to investigate further.
Best regards, The ProVisualizer Team.
|
Try Cesium Website |
| 22 May 2024 |
My question is for Nakoma GC. The first hole the big tree on the left corner of the dogleg was replaced by a bunker. But the hole is an old image with the tree still there. I’m assuming you have to wait to get the new image? Curious how this works? Thanks so much.
Answer: Yes, we have to wait for the imagery to be updated. Typically it is updated about once per year, but it can be less frequent in remote areas. Based on the timeline in Google Earth, it looks like the tree was replaced by a bunker in June or July 2023. That's about a year ago, so we would expect the imagery to be updated fairly soon, assuming there is an annual update schedule in that region.
Hope that answers your question.
Best regards, The ProVisualizer Team.
|
Imagery is Typically Updated Annually but Some Regions can be Less Frequent |
| 25 Apr 2024 |
I get a black screen when viewing your course maps on Safari although they work fine on Google Chrome.
Also when I select the cones they no longer appear. Any ideas? Thanks
Answer: There seems to be an ongoing issue with Apple devices and Safari in particular.
Some device and browser version combinations work fine but others don't.
We only have a limited selection of Apple devices to test on, and we have never been able to find the root cause of these issues.
However, we suspect that some versions are not fully compatible with the Cesium graphics library used by ProVisualizer.
If you are only occasionally seeing a black screen, it might just be a timeout due to limited internet bandwidth, and refreshing the page in your browser should fix it.
However, if you are always 100% of the time seeing a black screen, then it probably means your particular combination of device and browser doesn't support all the necessary graphics functions.
In this case, the only thing we can suggest is to try a different browser.
Regarding the cones, these are drawn using the same graphics functions as the measures and green grids.
Therefore, if the measures and green grids are working, the cones should also work.
If some of the functions are working and some are not, then it could be a more subtle compatibility issue.
As above, the only thing we can suggest is to try a different browser.
Hope that helps.
Best regards, The ProVisualizer Team.
|
Try Refreshing Page or Try Different Browser |
| 19 Apr 2024 |
I am new to this and have access to a launch monitor. So my question is in relation to the Dispersion tool. Should the left and right be the furthest left/right I hit with say 30 balls. Or the average left and right? Thanks
Answer: The short answer is that you should enter the furthest left/right, ignoring any unrepresentative outliers.
The long answer is that even if you hit 100 balls with each club, a launch monitor might not give you an accurate measure of your true on-course dispersion.
Therefore, we would recommend validating the launch monitor dispersion by going to your home course (or any course you know well) in the 2D/3D Planner and checking that the dispersion patterns agree with reality.
For example, find a long par 4 or par 5 where you normally hit a driver, and check that the dispersion pattern is an accurate representation of your true on-course driver dispersion.
Then find some long, medium and short approach shots and check that those dispersion patterns are also accurate representations of your true on-course dispersion.
If any of the above are inaccurate, adjust the spread on your dispersion profile as required to get an accurate representation of your true on-course dispersion.
If it all looks accurate on your home course, you can then use the dispersion overlay with confidence on other courses.
Also, don't forget that the Dispersion overlay is just one of the tools available on ProVisualizer for helping you identify the best target zones and best strategy options. There are also the Cones and Measure buttons, which give you alternative ways to think about the size of the target zones. You can use any combination of these tools, plus your own experience, to help you plan your strategy.
Hope that helps, but please don't hesitate to ask if you have any other questions.
Best regards, The ProVisualizer Team.
|
Verify Dispersion Profile is Accurate on Home Course |
| 7 Apr 2024 |
Hello, I love the Mobile Planner! I am however missing the club selection on the Mobile Planner. If there was a way to add this under the distances of the shots that would be a great help and even further elevate the tool!
Answer: Unfortunately, the rules of golf do not permit distance measuring devices to provide club recommendations (see rule 4.3a), so we can't directly tell you which club to use.
However, if you click the "..." button just below the compass on the Mobile Planner, it will show your profile with your yardages for each club, so you can quickly check which club is the best match for each shot.
Hope that helps, but please let us know if you have any further feedback.
Best regards, The ProVisualizer Team.
|
Not Allowed |
| 3 Apr 2024 |
Are we able to print these please? - the cone for ALL shots - the measurements markings - the symbols like ABC, tick, cross, etc. I can see "Notes" on upper left hand corner in 2D Planner, but how do I edit it? Thanks!
Answer: We have modified the Yardage Charts so that it now draws the cones for all shots instead of just the tee shot.
To add notes using the 2D/3D Planner, click just below where it says "Notes" and then type the required notes. If you have already clicked the "Save As" button, the notes will be automatically saved. If you haven't already clicked the "Save As" button, you need to click it to save the course with the notes to My Courses.
To print the measurements, symbols and notes, first make sure you have clicked the "Save As" button on the 2D/3D Planner, then go to My Courses and click "Yardage Charts". The measurements, symbols and notes should all be displayed on the yardage charts exactly the same as on the 2D/3D Planner.
Hope that answers your questions, but please let us know if you have any further feedback.
Best regards, The ProVisualizer Team.
|
Complete |
| 18 Mar 2024 |
I find the "Save As" button confusing. It's fine the first time I save a course, but maybe an "Update" button would be more intuitive for saving any subsequent edits, rather than auto-saving?
Answer: The problem with an "Update" button is that it would be really easy to forget to click it. Also, if you accidentally click "Back" or "Refresh" or any other link that takes you away from the page, you would immediately lose your edits with no warning and no way to recover them. Therefore, auto-saving any edits after the initial "Save As" seems like the only sensible option to us.
Note that if you go back to the pre-mapped course on the Global Map, A to Z or Pro Calendar, it will be a new copy of the course without your original edits. To view/edit one of your saved courses, go to the 2D/3D Planner in the top menu and select the course in the drop-down list. Any subsequent edits will then be auto-saved. If you want to play around with different strategy options without affecting the original saved course, you can use the "Save As" button to create a copy of the course. You can then either keep both copies, or discard one or the other using the "Delete" button in My Courses.
Note also that auto-save is standard practice for online editing tools such as Google Docs, etc., so most users will expect it.
Hope that makes sense.
Best regards, The ProVisualizer Team.
|
Auto-Save is Standard Practice for Online Editing |
| 10 Mar 2024 |
I cannot find my courses that I spent 4+ hours mapping, entering tee box, and shot selection, data. I made sure to "save as" for both courses (at Ballybunion). What can be done?
Answer: When you click the "Save As" button in the 2D/3D Planner, the course is saved to your browser's local storage and any further edits are automatically saved. Your saved courses will be listed under My Courses and they will also be available in the "Select Course" drop-down list in the 2D/3D Planner. If there are no courses listed under My Courses, the most likely explanation is that the browser's local storage was somehow cleared out, e.g. by uninstalling and re-installing the browser, or maybe if the browser's history was cleared. The only other explanation we can think of is that the courses might have been saved under a different browser profile, e.g. some browsers allow you to set up multiple profiles for personal, work, etc. If you have multiple profiles, it's worth checking them all, just in case you accidentally saved the courses under a different profile.
If you can't find the courses, the only option is to start again. That's actually not so bad because you will know the course layout really well by the time you've finished.
Note that if you come out of the 2D/3D Planner and then decide to make some more edits, you have to go to the 2D/3D Planner from the top menu and then select the course in the drop-down list. If you go back to the pre-mapped course on the Global Map or A to Z it will be a new copy of the course without your original edits. Note also that you can make a copy of your saved course by selecting it in the drop-down list in the 2D/3D Planner, entering a slightly different name, e.g. "Ballybunion 2" and then clicking "Save As". This can be useful if you want to play around with different strategy options without affecting your primary saved course.
Hope that helps, but please let us know if you have any further feedback.
Best regards, The ProVisualizer Team.
|
Check All Browser Profiles |
| 28 Feb 2024 |
I would love a window that creates a PDF of all the mapped holes with just three things per hole, an image of the hole, the par/yardage numbers, and your targets/distances. Then users could download the PDF and print it out to use in matches or on courses that don't allow electronics.
Answer: Go to any course (e.g. Pebble Beach) and click on "Yardage Charts" just below the map at the top of the page. There are lots of options for adjusting the page size, orientation, text layout, overlay brightness, zoom level, rotation, green grids, etc. You can either print the images directly or use a Snipping Tool to copy and paste the images into a document (e.g. Microsoft Word, Google Docs, etc.) which you can then convert to PDF and/or print as required.
You can also use the 2D/3D Planner to move the Tee/Pin/Target positions and add Notes, Measures and Symbols. Click the "Save As" button on the 2D/3D Planner to save your custom course to My Courses. Then go to My Courses and click the "Yardage Charts" button to either print the yardage charts directly or snip the images into a document.
You can also snip images directly from the 2D/3D Planner if you wish.
Hopefully that covers everything you wanted, but please let us know if you have any further feedback.
Best regards, The ProVisualizer Team.
|
Use Snipping Tool to Copy and Paste Images into Document |
| 22 Feb 2024 |
I have used one browser for course map 1, and another browser for course map 2, can I combine the 2? or can I copy and paste course map 2 into the other browser session? Thanks!
Answer: To copy a course from browser A to browser B, follow these steps:
- Go to "My Courses" in browser A and click "Link" and then "Copy to Clipboard".
- Open a blank tab in browser B and paste the link into the address bar at the top.
- Click on "2D Planner" or "3D Planner" to view the course, and then click "Save As".
- The course will then be saved to "My Courses" in browser B.
Hope that helps.
Best regards, The ProVisualizer Team.
|
Use Link Button on My Courses |
| 16 Feb 2024 |
Love the weather integration that is available in the 2D/3D Planner. Is there a way to print that data on the yardage book pages?
Answer: No, there isn't an option to print weather data on the Yardage Charts. This is because the weather forecast is likely to change and become more accurate as you get closer to the date/time you are playing. We recommend printing the Yardage Charts at least a week in advance, just in case the website goes down or is somehow unavailable for a while. You can then use the 2D/3D Planner to check the weather forecast just before you play, and draw arrows in the margins of the Yardage Charts to indicate the wind direction on each hole. If you use a pencil, you can erase the arrows and reuse the Yardage Charts multiple times.
Hope that makes sense.
Best regards, The ProVisualizer Team.
|
Draw Wind Arrows using Pencil then Erase and Reuse |
| 10 Feb 2024 |
For beginners, they sometime need to be less aggressive and plan for 2+ over par. Say for par 5, can we have more "Set Target"s like Set Target #4 or even #5? Thanks!
Answer: We understand what you are asking for. However, the maximum number of targets affects almost everything throughout ProVisualizer, e.g. the amount of space required in the interface for buttons and yardage, clubbing, elevation and "plays like" information, etc., all the way down to the encoding of saved courses and course links, so it's not easy to change. The limit of three targets allows for planning up to 4 shots on each hole (tee shot, two fairway shots, then approach shot), so it should be enough for all but the very longest holes. For extremely long holes that require more than 3 targets, you could set the first three targets and then use the "Measure" button to indicate additional shots between the third target and the green, e.g. measure the distance from the third target to where you would like to put the fourth target, and then measure the distance from the fourth target to the green. It's not perfect, but it's the best solution we can think of.
Hope that's OK.
Best regards, The ProVisualizer Team.
|
Use "Measure" Button to Indicate Extra Shots |
| 16 Jan 2024 |
Hello, I am unable to see Google Earth on your website when in 3D/2D planning mode. I am using Microsoft Edge as my browser. Any settings I need to readjust? Thanks
Answer: The Google Earth buttons on the 2D/3D Planner work by generating small KML files. Microsoft Edge is more cautious than other browsers and doesn't automatically open the KML files in Google Earth. See this article for instructions on how to override this behaviour. Alternatively, you could use Chrome or Firefox, which both allow you to choose to automatically open KML files in Google Earth.
Hope that helps.
Best regards, The ProVisualizer Team.
|
Adjust Settings or Use Chrome or Firefox |
| 8 Jan 2024 |
Any chance you will do the Asian Tour and International Series tour locations in 2024? The first event is in Malaysia but "The Mines" is not on the A-Z list ..... thanks!
Answer: Thanks for the suggestion. We don't plan to publish the schedule on our Pro Calendar as it would be too much work to keep the schedule accurate and up-to-date. However, we will try to map as many of the courses as we can and add them to the Global Map and A to Z.
The first event is available here: The Mines Resort & Golf Club.
Hope that's OK.
Best regards, The ProVisualizer Team.
|
In Progress |
| 7 Jan 2024 |
I am a member of St Davids City Golf Club, the most westerly course in Wales. We are a nine hole course with different tees and length of hole for the different 9s. Your course planner only provides details of 9 holes 5 of which have visuals and yardages for the second 9 (holes 2,3,5,8,and 9) the remaining holes are correct for the first 9 holes. We have just been measured by wales golf and I can send you their yardages if that would help. Are you able to update the information on our course?
Answer: As with all courses on ProVisualizer, we only map one set of tees. It's then up to the user to consider which alternative tees they might be playing from, and measure all the relevant distances to hazards, etc., from the alternative tees using the "Measure" button on the 2D/3D Planner. This is normally much quicker and easier than mapping two sets of tees to create an 18-hole course. Another advantage is that you only need to print 9 holes instead of 18 if you are creating your own Yardage Charts.
Hope that makes sense.
Best regards, The ProVisualizer Team.
|
Use Measure Button on 2D/3D Planner |
| 12 Dec 2023 |
Is there a way to add 'notes' to each hole?
Answer: Yes. Go to the 2D/3D Planner, use the "Next Hole" button to step through the holes, and for each hole click just below where it says "Notes" in the top left corner of the map. You can then type any notes you like. If you've already saved the course to My Courses, the notes will be automatically saved. If it's a new course, use the "Save As" button to save it to My Courses with the notes. You can then go to My Courses and either click "Notes" to see the notes that have been saved with the course, or click "Link" to send the course with the notes to your friends, or click "Yardage Charts" to print your own yardage charts with notes.
Hope that helps.
Best regards, The ProVisualizer Team.
|
Use 2D/3D Planner |
| 1 Nov 2023 |
Please could you map The Lido at Sand Valley.
Answer: Unfortunately there is no imagery available for this course at the moment, but we will definitely map it as soon as we can.
Update: The imagery is now available and we have mapped it here: The Lido.
|
Complete |
| 25 Oct 2023 |
When using the Mobile Planner on Google Chrome on an Android phone, the distance lines from the tee (top 3 clubs/250/230/210 etc) are no longer showing. I wasn't sure if this is something you are aware of. It was certainly working fine earlier in the year. Thanks for your help.
Answer: We cannot reproduce this issue. It works fine with Chrome on our Motorola Android phone. However, there are hundreds of different devices and different versions of Android, so it's possible there could be some combinations of browser and device that don't support all the necessary graphics routines. The only thing we can suggest is to try a different browser, e.g. Firefox seems to work well on most devices.
Hope that helps.
Best regards, The ProVisualizer Team.
|
Cannot Reproduce
Try Different
Browser |
| 18 Oct 2023 |
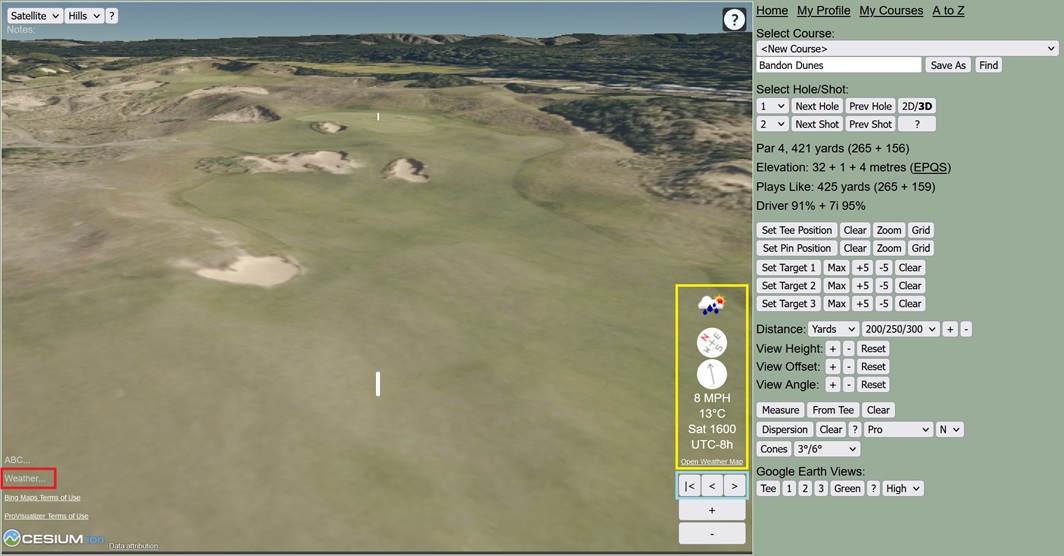
Hey Guys. I think it would be awesome if you could add an option for wind direction (manually inputted direction is ok). This will help determine where one might need to club up or down for the prevailing wind, or for the wind during a round that is coming up in the next few days! Cheers
Answer: We have added a weather option to the 2D/3D Planner as shown in the following image:
To see the weather, click the small "Weather..." option highlighted red in the bottom left corner of the map. This brings up the weather information highlighted in yellow. You can then use the buttons highlighted in blue to step through the time intervals in the weather forecast. The wind speed is shown in MPH/KPH when working in Yards/Metres, and the arrow in the white circle below the compass shows the wind direction. The temperature is shown just below the wind speed, and the symbol above the compass indicates sun, cloud, rain, etc. The day, time and timezone are shown just below the temperature.
Hopefully that covers everything you wanted, but please let us know if you have any other feedback.
Best regards, The ProVisualizer Team.
|
Complete |
| 15 Sep 2023 |
Is it a possibility to add the distances between the tee boxes? Similar to rings so people would be able to gauge the change when playing from anything other than the backs?
Answer: There are already a couple of ways to do this. The quickest and easiest is simply to click the "Tee Grid" button on the 2D/3D Planner and Yardage Charts. This will draw 10-yard lines from 50-yards back to 100-yards forward. Alternatively, if you want the precise yardage, you can use the "Measure" button on the 2D/3D Planner to measure exactly how far back/forward each tee block is. You could also measure the exact distance to the hazards from each tee block so you can read the distance directly without having to do any addition/subtraction.
Hopefully that covers everything you wanted, but please let us know if you have any other feedback.
Best regards, The ProVisualizer Team.
|
Use Grid
and Measure
Buttons |
| 11 Sep 2023 |
It would be nice to have an editable output that lists every distance for every shot so I can stand on the tee and have a print-out that tells me what club or distance to hit. Then I could add notes like "stay left".
Answer: Good idea. We have added a "Notes" button to My Courses. If you click this button, it will list the Hole, Par, Length, Shot Lengths and any Notes that you have added to the holes using the 2D/3D Planner. You can then copy and paste this into a document, reformat it as required, e.g. adjust font size, etc., and then print it.
Hopefully that covers everything you wanted, but please let us know if you have any other feedback.
Best regards, The ProVisualizer Team.
|
Complete |
| 2 Jul 2023 |
Hi Guys, I am using iPad and can't seem to get the 300/275/250 yardage circles? Is this still an issue from previous questions I've read below or am I doing something wrong?
Answer: Unfortunately, there still seems to be a bug in Safari (the default browser) on some versions of iPad that causes any opacity less than 1.0 to be treated as 0.0, i.e. invisible. If you cannot see the circles, first try setting the circle brightness to 10 and make sure you are viewing the course in 2D mode, as the circles are deliberately not shown in 3D mode. If you still can't see the circles, then you will probably need to switch to a different browser. Chrome seems to be working well at the moment on all the iPads we have available for testing, so that's probably the first one to try.
Hope that helps.
Best regards, The ProVisualizer Team.
|
Safari Bug
Use Chrome |
| 1 Jul 2023 |
Could you add a page for Canadian courses sortable by province?
Answer: To do this, we would have to collect and maintain address information for every course worldwide, which would be too much work.
However, you can search geographically using our Global Map.
Hope that's OK.
Best regards, The ProVisualizer Team.
|
Use Global Map |
| 13 Jun 2023 |
How can I change the tees the yardages are measured from? The default for my home course is to measure all yardage from the black/pro tees, but I only play from the blue tees. The yardage charts are not helpful if the yardages are not the yardages I play.
Answer: You can use the "Set Tee Position" button on the 2D/3D Planner to move the tees to the position you play from. You can then click "Save As" to save the adjusted map to "My Courses". You can then go to "My Courses" and click the "Yardage Charts" button to print the adjusted yardage charts.
Hopefully that all makes sense, but please don't hesitate to ask if you have any other questions.
Best regards, The ProVisualizer Team.
|
Use 2D/3D Planner |
| 22 May 2023 |
Nudgee Golf Club in Brisbane has undergone a complete renovation of 36 holes. On ProVisualizer the overhead view still shows the work in progress. Can you update the imagery?
Answer: We have switched Nudgee Golf Club from Bing to Esri imagery and it now shows the completed renovation.
We have also mapped both courses and added them to the A to Z and Global Map.
Here are the direct links: Bulka Course and Kurrai Course.
Hopefully that's all good now, but please let us know if you have any other feedback.
Best regards, The ProVisualizer Team.
|
Complete |
| 15 May 2023 |
Is it possible to annotate holes with notes (e.g. "Stay Left") and symbols (e.g. red crosses for penalty areas) and then print the annotated yardage book with the notes and symbols?
Answer: Yes! You can use the 2D/3D Planner to add notes (top left of map) and symbols (click "ABC..." in bottom left of map) to any course. You can then click "Save As" to save the annotated course to "My Courses". You can then go to "My Courses" and click "Yardage Charts" to print the annotated yardage book.
Hope that makes sense, but please let us know if you have any other feedback.
Best regards, The ProVisualizer Team.
|
Use 2D/3D Planner |
| 3 Apr 2023 |
Is it possible to update your satellite images so I can map Arcadia Bluffs South Course? When I navigate to that area, all I see is farm fields on your site. Thanks.
Answer: Unfortunately neither of the two imagery providers that we use (Bing and Esri) have any imagery of that course yet. Typically the imagery is updated about once per year, but it can sometimes take longer in remote areas. Hopefully we won't have to wait too much longer, as it looks like a really great course.
On the positive side, we have added high-definition terrain data for the Bluffs Course, so you can get a much more reallistic view of that course if you go to the 3D Planner and select "Hills" in the drop-down in the top-left corner.
Best regards, The ProVisualizer Team.
Update: The imagery is now available and we have mapped it here: Arcadia Bluffs South Course.
|
Complete |
| 8 Mar 2023 |
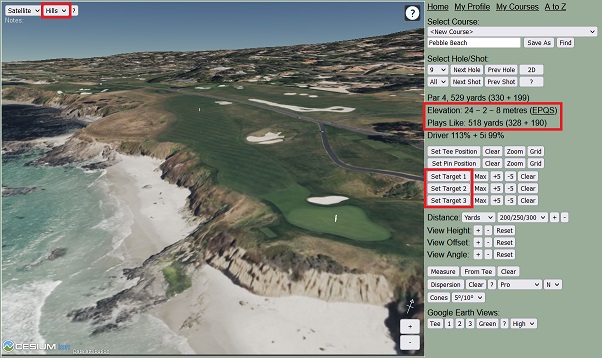
Would it be possible to add slope effect from various yardages - say 100, 150 and 200 yards from the centre of the green, and off the tee too, from the relative heights? This would be really helpful in the planning process.
Answer: The best way to see the slopes is to go to the 3D Planner and select "Hills" in the drop down list in the top left corner. Here is an example screenshot looking back up the 9th at Pebble Beach:
To get the exact elevation/slope and "plays like" distance, use the "Set Target 1/2/3" buttons to move the targets to any location. The elevation/slope and "plays like" distance will then be re-calculated and displayed in the panel on the right.
Note that the 3D Planner requires a reasonably powerful processor. It should run well on any modern laptop/workstation, but the 2D Planner, which has exactly the same elevation/slope and "plays like" information, might be a better option on less powerful devices.
Hope that helps, but please let us know if you have any further feedback.
Best regards, The ProVisualizer Team.
|
Use 3D Planner |
| 25 Feb 2023 |
On iPad the yardage rings are not visible (a few weeks ago it was working, but not now). This issue has been reported a few times before.
Answer: This seems to be a bug in Safari. If we set the circle opacity to 1.0 then the circles are visible, but any opacity less than 1.0 is treated as 0.0, which is invisible. This bug affects lines as well as circles, which is why the centre lines are also invisible on the 2D Planner in Safari on iPad.
There is nothing we can do to work around this issue, so the only solution is to use a different browser, e.g. Chrome seems to be working well on iPad at the moment.
Hope that helps.
Best regards, The ProVisualizer Team.
|
Safari Bug
Use Chrome |
| 14 Feb 2023 |
On iPhone, when I save the Mobile Planner to my Home Screen in order to view full screen, "My Top 3" populates as 290/265/240 instead of the 300/285/250 that my profile is set up to. Is there a workaround for this?
Answer: Thanks for reporting this. It appears that iPhone gives the Mobile Planner a separate data store when you save it to the Home Screen, so it cannot see the data saved under My Profile on the website. This is why it gives the default values for "My Top 3" instead of your custom values.
To work around the issue, we have added a new "..." button to the Mobile Planner. If you click this button, it will display your profile, and you can adjust your top 3/4/5 as required. Click on any number to edit your profile, then click the "Map" button to go back to the map screen.
Hopefully that solves your issue, but please let us know if you have any other feedback.
Best regards, The ProVisualizer Team.
|
Complete |
| 9 Jan 2023 |
I reviewed the video about using Google Earth Pro, but when I follow the instructions to integrate my course with Google Earth (open Google Earth Pro, click on Google Earth Views - Tee), the system just gives me a file name, which I then have to save, get out of Google Earth and ProVisualizer, and open the file separately. Am I doing something wrong? Is there a way to integrate Google Earth directly from the 3D screen (as shown in the video) or do I have to stick with what I've got?
Answer: You need to tell Windows to always open KML files using Google Earth. To do this, right click on one of the downloaded KML files and click "Open with > Choose another app", select Google Earth and check the option to "Always use this app to open .kml files", and then click "OK". Google Earth should then automatically open the KML file and zoom to the correct location when you click the Google Earth View in ProVisualizer. You might also need to adjust your browser settings so it automatically saves the file instead of asking you if you want to save it. For example, in Chrome, click the arrow next to the downloaded KML file and click "Always open files of this type". Once it's all set up, it should be very slick.
Hope that helps.
Best regards, The ProVisualizer Team.
|
Setup Issue |
| 6 Dec 2022 |
I am not able to see Google Earth hole layouts now. Are you guys working on that?
Answer: We haven't changed any code recently, and everything is still working fine on all the laptops, tablets and phones we have available for testing. If it's still not working for you, please let us know precisely which laptop/tablet/phone and browser you are using. Please also include your email address if you would like a direct reply.
Best regards, The ProVisualizer Team.
|
More Info Needed |
| 24 Oct 2022 |
Is there a free form line draw tool along with the ability to place directional arrows?
This would allow individual to map fairway/green contours. Thanks
Answer: We don't have any free-form drawing tools in ProVisualizer. However, if you are producing your own yardage books, you could use a Snipping Tool to copy the images from ProVisualizer into a drawing app, e.g. "Paint". You could then use the drawing app to add the fairway/green contours.
Hope that helps.
Best regards, The ProVisualizer Team.
|
Use Drawing App |
| 17 Oct 2022 |
Hi Guys, Love what you do.
I can't seem to get the driving distance rings on the Mobile Planner anymore.
Is there any way of fixing this? Thanks
Answer: This sounds like the same iPad/iPhone issue that was reported on 22 Aug 2022.
If it is, then it should now be fixed.
The solution was to upgrade to the latest version of the Cesium graphics library that we use to display the maps.
If it still isn't working for you, please submit a new feedback with the exact make/model/version of your device.
Hope that helps.
Best regards, The ProVisualizer Team.
|
Fixed
(We Think) |
| 12 Oct 2022 |
Hi, great site! Would you be able to add the DP Challenge Tour courses please?
Answer: Thanks very much for the feedback.
We have created a Challenge Tour page on the Pro Calendar
here.
We will gradually build up the list of courses over the next few weeks.
Best regards, The ProVisualizer Team.
|
Complete |
| 22 Aug 2022 |
Hello. Hopefully you can help. When I am viewing a course on 2D Planner mode on my iPad, the distance circles from the tee and to the green won’t show. I have changed the circle number to 10 but still nothing. I have tried this on Safari, Chrome and Firefox but have the same issue on each browser. On my Android phone, the lines show fine. I was wondering if you have come across this before and if you know of a way to fix it. Thank you for your help.
Answer: Yes, we have come across this before. It was working fine on iPad and iPhone a few months ago, but then it suddenly stopped working without us changing any of the ProVisualizer code. Also, it stopped working in all browsers at exactly the same time. Therefore, the only explanation we can think of is that there must have been an Apple update that has broken one of the graphics functions that Cesium (the graphics library used by ProVisualizer) uses to draw circles.
We have tried upgrading to the latest version of Cesium, but it didn't make any difference.
Unfortunately, there doesn't yet seem to be a workaround, so there's nothing that we can do or recommend at the moment.
We will continue regularly checking to see if there is a workaround available, but probably we will have to wait for an Apple update to fix it.
Sorry we can't be of more help.
Best regards, The ProVisualizer Team.
Update (18 Oct 2022): The latest version of Cesium seems to have fixed this issue on the Apple devices that we have available for testing. If it still isn't working for you, please submit another feedback with the exact model/version of your device.
Hope that helps.
Best regards, The ProVisualizer Team.
|
Fixed
(We Think) |
| 2 Aug 2022 |
In the 2D Planner the tool gives suggestions on the clubs that one needs to play (based on the stats you can provide for your clubs). Is there any way these suggestions could be made available in the Mobile Planner, with the option to either take elevation into account or not, so to make the Mobile Planner still usable in competitions.
Answer: Thanks very much for the feedback. However, the rules of golf do not allow distance measuring devices to display club recommendations, so unfortunately we're not allowed do this. The only thing we can suggest is to make a note of your club distances on a piece of paper so you can look up the correct club when you are on the course. You can use the "Print This Profile" button on the "My Profile" page to do this if you have access to a printer. Hope that helps a bit.
Best regards, The ProVisualizer Team.
|
Not Allowed |
| 15 Jul 2022 |
I love this tool and I use it more and more during my round of play. However, when I use the mobileplanner I miss the measurements to the bunkers and run-outs of the fairway. I often use these measurements for planning alternative plays on a hole and I can't see them in the mobileplanner. Is it possible to make the measurements visible in the mobileplanner?
Answer: Thanks very much for the feedback. We have updated the Mobile Planner to display measurements exactly the same as the 2D/3D Planner.
Hopefully that's all OK, but please let us know if you have any further feedback.
Best regards, The ProVisualizer Team.
|
Complete |
| 20 Feb 2022 |
Please make text associated with "measure from tee" editable to make bigger and bolder. The text is virtually impossible to read when printed in a booklet format against background. Also would be nice to change brightness/contrast of terrain in background and make lines more visible for printing.
Answer: Thanks very much for the feedback. We have added a new "Text" drop-down to the Yardage Charts so you can adjust the size of the text associated with measures and symbols. You can also use the "Background" drop-down to adjust the intensity of the background, and the "Center Line" and "Circles" drop-downs to adjust the brightness of the center line and circle overlays. Note also that you can use the "Tee Shot" and "Approach" options to zoom in if it's not possible to make all the information readable on the "Overview".
Hopefully that's OK, but please let us know if you have any further feedback.
Best regards, The ProVisualizer Team.
|
Complete |
| 7 Feb 2022 |
Please could you add Bougle Run which is the new 14 hole course in Bridport, Tasmania, Australia.
Answer: Unfortunately there is no good imagery available for this course at the moment. However, we will definitely map it as soon as the imagery becomes available.
Update: The imagery is now available and we have mapped it here.
Best regards, The ProVisualizer Team.
|
Complete |
| 24 Jan 2022 |
Can the imagery for Royal Norwich Golf Club in the United Kingdom be updated? Your current imagery shows the course as it was "under construction". The latest Google imagery actually shows fairways and greens.
Answer: The new imagery is now available. Great looking course!
Best regards, The ProVisualizer Team.
|
Complete |
| 25 Nov 2021 |
Obviously the maps cannot be in real time and some are older than others. Is it possible to know the currency date of the course I am looking at?
Answer: Unfortunately there is no simple answer, as the imagery is a mosaic of many different sources captured on many different dates. Even for a single course, it can be a combination of multiple sources and multiple dates at different zoom levels. In short, every single imagery tile can be from a different source captured on a different date, and there is no easy way to get the metadata.
The only thing we can suggest is to use the "timeline" feature in Google Earth Pro. If you slide the timeline all the way forward to the most up-to-date imagery, you can check if there are any significant differences compared to the ProVisualizer imagery. If not, then you know the ProVisualizer imagery is at least as up-to-date as the date of the latest imagery in Google Earth Pro. This is the best way to check the currency of the imagery that we know of.
Hope that helps a bit.
Best regards, The ProVisualizer Team.
|
Use Google Earth Pro Timeline |
| 23 Nov 2021 |
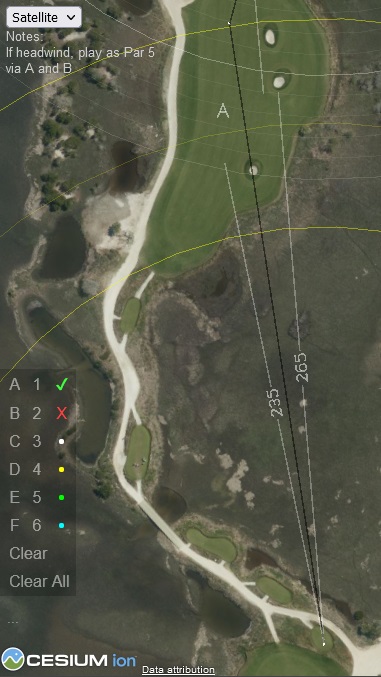
Would you consider the possibility to add a small button with a capital L inside so that one could define a target 1, 2 or 3 shot as a layup? Also, make it so that if that target shot was thus marked or flagged that layup shot would not count to the par of the hole. As it is, there are some par 4 holes that I (and I presume a lot of other players as well) cannot get to the green without a layup shot, those holes come up as par 5's. Thnx
Answer: The best way to mark layup targets is to use Measures, Notes and Symbols as shown in the screenshots below. To add a Measure from the tee to an alternative target or hazard, click the "From Tee" button, then click the alternative target or hazard. To add a Measure from any point to a layup point, click the "Measure" button, then click the first point on the map, then click the layup point. To add a Note, click the map just below where it says "Notes" in the top left corner, then type the required text. To add a Symbol, click the "..." just above the Cesium logo in the bottom left corner of the map to bring up the symbol panel, then click the required Symbol, then click the map where you want to put the symbol.
Hopefully that all makes sense, but please let us know if you have any further feedback.
Best regards, The ProVisualizer Team.
|
Use Measures Notes and Symbols |
| 23 Nov 2021 |
During planning of a course, I noticed that the yardages I have chosen for target shots result in clubs that I have marked as hidden in the profile. Shouldn't these clubs be ignored by the planner?.
Answer: We cannot reproduce this problem. Please double-check you have the correct profile selected on the "My Profile" page. If the problem persists, please submit another feedback with your email address so we can contact you directly.
Best regards, The ProVisualizer Team.
|
Cannot Reproduce |
| 15 Aug 2021 |
I would love to see my top 3/4/5 of distances as yellow circles in the mobile version (similar as in the normal desktop viewer). This would help me very much on the course.
Answer: Thanks very much for the feedback. We have added a drop-down on the bottom right corner of the map so you can select which yellow circles you wish to see.
Best regards, The ProVisualizer Team.
|
Complete |
| 8 Jun 2021 |
Awesome Tool! Thank you for all your work! One question/feature request: Is it possible to add the cones within the 2D/3D planners? Thanks!
Answer: Thanks very much for the feedback. We have added the Cones button just below the Dispersion button on the 2D/3D Planners.
Best regards, The ProVisualizer Team.
|
Complete |
| 4 Jun 2021 |
Will you be adding 4, 5 or 6 hybrid club selection?
Answer: Thanks very much for the feedback. We have added the ability to rename your clubs however you wish.
To rename a club, go to My Profile, then type in the new name, then press the Tab key on your laptop, or click anywhere on the background on a tablet.
For example, you can rename "4-iron" to "4-hybrid", "5-iron" to "5-hybrid", "6-iron" to "6-hybrid", etc.
Hopefully that's all OK, but please let us know if you have any further feedback.
Best regards, The ProVisualizer Team.
|
Complete |
| 5 Apr 2021 |
Korn Ferry scheduled courses would be a huge help.
Answer: Thanks very much for the feedback. A few people have asked for this now, so we're going to do it.
Here it is: 2021 Korn Ferry Tour Schedule
Best regards, The ProVisualizer Team.
|
Complete |
| 5 Mar 2021 |
Hi guys A great resource thank you very much. A question please? Is there any way to include the customised shot dispersions on the yardage charts also?
Answer: Thanks very much for the feedback. We liked the idea and we tried to do it, but unfortunately it turned out to be too complicated. The main problem was that we would have had to bring in the elevation data so we could calculate the plays like distance and work out which club was required for each shot so we could look up the correct dispersion parameters for each shot. On top of that, we would then also have had to add all the dispersion buttons and the drop-down list of dispersion profiles, and we just couldn't see a good way of adding all of that without making the user interface too complicated.
However, it is still possible to create yardage charts with dispersion if you use a Snipping Tool to capture the images directly from the 2D Planner and paste them into a word processor document.
Hope that's OK.
Best regards, The ProVisualizer Team.
|
Use Snipping Tool to Capture Images from 2D Planner |
| 2 Mar 2021 |
I am playing in a tournament at a course I have never played, and after using your site I feel like I better know what to expect. Its like having a digital caddy! One thing: could you add the option for different tees?
Answer: Thanks very much for your feedback.
There are a few different ways you could do this:
- Use the "Save As" button on the 2D/3D Planner to create a copy of the course, e.g. "ABC Golf Club - White Tees", "ABC Golf Club - Yellow Tees", "ABC Golf Club - Red Tees", etc. This has the advantage that you can adjust the targets to the optimal position for each set of tees, but the disadvantage that you have to switch courses to see the alternative tees.
- Use the "Measure" button on the 2D/3D Planner to measure the distance forward from the back tee block to each of the alternative tee blocks. This has the advantage that you don't have to switch courses to see the alternative tees, but the disadvantage that you can't optimise the targets for the alternative tees. If you use this option, you can also add Notes in the top-left corner of the map to give the yardage from the alternative tees, e.g. "White - 450, Yellow - 425, Red - 400", etc.
- Finally, if you are printing Yardage Charts, you can use the "Tee Grid" option. This overlays a 10-yard grid from 50 yards back to 100 yards forward so you can easily see how far back/forward the alternative tee blocks are.
Hopefully one of those options will work for you, but please let us know if you have any further feedback.
Best regards, The ProVisualizer Team.
|
Use "Save As", "Measure", "Notes" and "Tee Grid" |
| 3 Oct 2020 |
I love this application. However when I use 'measure distance' or 'set target' the lines are not appearing.
I have tried selecting the different line colour options but all I get is a tiny white dot.
I am using Safari on a Mac. Any suggestions please.
Answer: The centre lines and measure lines are only shown when you are in 2D mode.
When you are in 3D mode, it only shows the tee, pin and target markers.
Use the "2D/3D" button next to the "Next Hole" and "Prev Hole" buttons to switch between 2D and 3D mode.
Also make sure that the "Line Brightness" is not zero. If it is zero, the centre lines will be invisible.
Note that you can force it to show the measure lines in 3D mode by clicking the "Measure" button.
If you do this, it will rotate and stretch the numbers so that they are readable from a low angle.
Hope that explains it, but if you are still having trouble, please submit another feedback with your
email address and we will be happy to explain in more detail.
Best regards, The ProVisualizer Team.
|
Click "2D" Button to See Measure Lines |
| 15 Sep 2020 |
Fantastic tool, thx for creating. It would be great to have a feature to add notes on to the maps
(effectively callout boxes) and also to have the ability to draw target areas and areas to avoid
with coloured zones/highlights. Thanks.
Answer: We have added the ability to enter notes on the 2D/3D Planner, just below the Satellite/Terrain/Map drop-down.
You can enter multiple lines of text in any format you wish. The notes are included in course links and will be shown on the
Mobile Planner and Yardage Charts.
Regarding the ability to draw target areas, you can already do this fairly easily using the "Measure" and "From Tee" buttons.
To draw a cone-shaped target area for your tee shot, use the "From Tee" button to draw the sides of the cone and then the "Measure"
button to draw the lines across the top and bottom of the cone.
You can also use the "Measure" button to draw arbitrary polygonal zones, e.g. layup zones on par 5's, or zones to avoid.
We decided not to add the ability to draw coloured zones, as it would require lots of buttons for editing the zones and we felt
it would make the user interface too complicated.
Hope that's all OK.
Best regards, The ProVisualizer Team.
|
Complete |
| 30 Jul 2020 |
Hello team : Some laptops work properly and some others show these kind of errors :
An error occurred while rendering. Rendering has stopped. RuntimeError: Program failed to link.
Link log: error: Too many combined image uniforms, shader storage buffers and fragment outputs etc...
This one shows this error with FF, Chrome, Opera and Midori.
Answer: Thanks for the feedback. If it is consistently giving you the same error with every browser
then it sounds like it could be a compatibility issue with the graphics system on your laptop.
The graphics library that we use (CesiumJS) should work with most modern laptops. Try going to the
CesiumJS website here. If you get the same error there then there's probably nothing we can do.
However, if the CesiumJS website works, let us know and we will investigate further.
Please let us know how you get on.
Best regards, The ProVisualizer Team.
|
Try CesiumJS Website |
| 28 Jul 2020 |
Hi Team, I love this site! Such a helpful tool! I recently mapped a course called Bald Peak Colony
Club in New Hampshire. It looks like the image quality for the satellite view is of a fairly low quality
compared with other courses on the site. Is it possible to update the map with satellite imagery from
Bing maps, which has higher resolution aerial imagery? Please let me know your thoughts. Thanks
Answer: Thanks very much for the feedback. We had a look at the Bing imagery for your course.
It looked good when zoomed out, but the last two zoom levels were only marginally better than the
Esri imagery that we use by default. Therefore, in this case, we can't really justify using Bing imagery
as we only have limited credits and we need to save the credits for courses where it makes a bigger
difference.
Sorry we can't be more helpful this time, but hope you understand we have to use our credits where
they make the biggest difference. Hope that's OK.
Best regards, The ProVisualizer Team.
|
Not Justified In This Case |
| 27 Jul 2020 |
Hi, Please could you look at re-mapping Woodhall Spa Hotchkin Course, Lincolnshire, England.
It has had extensive renovations over the past three years with numerous bunkers added (and
some removed). The English Amateur Championships is there this week and the English Seniors
Championship the following week. I'm playing in the English Seniors and am using ProVisualizer
to develop my strategy and game plan. Thank You
Answer: Thanks very much for the feedback. Unfortunately none of the imagery providers that
are available to us have fully up-to-date imagery, so this is the best we can do at the moment.
The only thing we can suggest is to use the "Google Earth Views" on the 2D/3D Planner to view
the Google imagery side-by-side with the ProVisualizer imagery. Most of the holes look similar
but the Google imagery does show some new bunkering on the 1st, 2nd and 18th.
Hope that helps a bit.
Best regards, The ProVisualizer Team.
|
Use Google Earth Views |
| 16 Jul 2020 |
I notice the courses I've mapped don't show in the A-Z listing automatically.
I can see how I can share a link with playing partners, but what about everyone else?
Answer: Thanks very much for the feedback. Several people have now asked this question.
Unfortunately, we can't allow users to publish directly to the A-Z listing as it would be too much
work for us to verify the accuracy of the maps. There is also the question of who would maintain
the maps and keep them up-to-date.
However, you are certainly welcome to publish the courses on your own website or on course review
sites or social media sites. If you did that, then they should show up in Google searches so other
users will see them when searching for course maps.
Hope that's OK.
Best regards, The ProVisualizer Team.
|
Publishing directly to ProVisualizer not allowed |
| 8 Jul 2020 |
Great Tool Guys! Good Job! I was wondering if I could save my profile (clubs in bag, dispersion
and length info) so that I could use ProVisualizer on several computers. Thanks
Answer: Thanks very much for the feedback. We have added a new "Backup My Profile" button.
Go to "My Profile", click the "Backup My Profile" button, and follow the instructions to email the
profile to yourself. You can then open the email on the other device and click the links to restore
your distance and dispersion profiles to the other device.
Hopefully that all makes sense, but please let us know if you have any other feedback.
Best regards, The ProVisualizer Team.
|
Complete |
| 7 Jul 2020 |
Could you please include a tab perhaps of the Korn Ferry Tour courses?
Answer: Thanks very much for the feedback. We would love to add tabs for the Korn Ferry Tour and
all the other pro tours, but unfortunately it's too much work trying to maintain the schedules and keep
them up-to-date, especially with all the changes and cancellations that are happening at the moment.
However, we will definitely try to ensure that as many of the courses as possible are pre-mapped
and available on our A to Z directory here.
Also, if there are any courses missing from the A to Z, please don't hesitate to submit a course request
via this feedback page and we will map the course as quickly as we can.
Hope that's OK.
Best regards, The ProVisualizer Team.
|
See A to Z |
| 17 Jun 2020 |
Dear Provisualizer, I recently found your website and have really enjoyed using it since!
A really good tool to create personalized yardage books! I would like to know if it would be possible
to save/print all the pages at once i.e have all 18 holes in full detail in one PDF document instead
of having to save/print them all individually. I hope you understand what I am trying to say.
Thank you for the site!
Answer: Thanks very much for your feedback. It's a very good suggestion and we would love to
be able to do this, but unfortunately it's not as easy as it sounds. The main issue is that we would
have to construct 18 separate maps, which is more than most web browsers can handle.
Therefore, the best approach is to use a Snipping Tool to copy the yardage charts one at a time
into a document, and then print the document. This is actually the most reliable way to print the
yardage charts anyway, because it's much easier to adjust the margins and other printer settings
from within a document than printing directly from a browser.
Hope that helps!
Best regards, The ProVisualizer Team.
|
Use Snipping Tool |
| 7 Jan 2020 |
I just discovered this site and it's fantastic. 2 things-
Is it possible to include more Canadian courses, particularly the Golden Horseshoe region (Niagara-Toronto).
And a changing yardage number as the cursor scrolls.
I would find it easier to plot out my shots seeing the number as I move the cursor.
Great site!
Answer: Thanks very much for your feedback. Good to hear you like the site.
Regarding the Candian courses, we have added the four courses that you requested shortly after this feedback.
If there are any others, just let us know the names and addresses and we will add them as quick as we can.
Regarding the changing yardage number as you move the cursor, we have modified the "Set Target" buttons
so that you can now right-click on the map as well as left-click. If you left-click on the map, it sets the target and
de-activates the button exactly as before. If you right-click, it sets the target but also keeps the button active.
Each time you right-click, it updates the distance information in the panel on the right, so you can see the exact
yardage of each shot. This allows you to quickly try multiple targets by right-clicking before selecting the best
target with a left-click.
The right-click option also works when setting the tee and pin positions, so you can quickly check the distance
from multiple tee positions and multiple pin positions.
We think this is a really good improvement, so thanks again for the suggestion, very much appreciated!
Hopefully it works well for you too, but please let us know if you have any further feedback.
Best regards, The ProVisualizer Team.
|
Complete |
| 18 Aug 2019 |
Great tool to create yardage book for any courses. Would be great if you could update the map.
Answer: We don't allow direct updates to pre-mapped courses because it would be too much work for us to
verify the changes. However, you can use the Set Tee/Pin/Target Position buttons on the 2D and 3D Planners
to adjust the map, and then click the "Save As" button to save the updated map to "My Courses". You can then
use the "Link" button on "My Courses" to generate a page for your course just like the pre-mapped courses.
You can then email the link to your friends or post it to social media or discussion groups, or even start your
own website with links to all the courses you have played.
Alternatively, if one of the pre-mapped courses has changed and needs updating, please let us know via this
feedback page, and we will re-map it as soon as possible.
Hope that makes sense.
Best regards, The ProVisualizer Team.
|
Use 2D/3D Planner and Save to My Courses |
| 3 Aug 2019 |
Is there any way to get a more clear image of some courses?
Some can be tough to distinguish between tee ground and fairway (where the green starts and ends, etc)
Answer: By default we use Esri imagery, but we do have the ability to use Bing imagery on selected courses.
Bing imagery is too expensive to use on every course and in most cases is no better than Esri imagery.
However, if you let us know the name of the course, we will check to see if the Bing imagery is good enough
to justify the extra cost.
You can also use the "Google Earth" buttons on the 2D Planner and 3D Planner to see the Google imagery.
If you save the course in the 2D Planner or 3D Planner, you can then also use the "KML" button
on "My Courses" to generate a shot-by-shot fly-over tour in Google Earth.
Hope that helps, but please let us know if there is a specific course you are having trouble with, and
we will see if there is any way we can get some better imagery.
Best regards, The ProVisualizer Team.
|
Need Course Name |
| 15 May 2019 |
The circles are not showing up on my computer??? I cannot find where you might be able to turn
that setting on/off.
Answer: Try setting the "Circle Brightness" up to 10 on the 2D Planner. If the circles still don't show
then it sounds like there might be an issue with your browser. The latest version of Chrome on some
platforms seems to have disabled support for one of the rendering functions used by the Cesium 3D
graphics library that we use. Therefore, it's probably worth trying a different browser if you can.
Firefox and Edge both seem to work OK on platforms where we have seen the issue with Chrome.
Hope that helps.
Best regards, The ProVisualizer Team.
|
Try Different Browser |
| 9 Apr 2019 |
Hi, what a great program, just struggling to get my home course of Filey up and running.
Any help would be most welcome.
Answer: Thanks very much for your feedback. Step-by-step instructions for mapping your course
are available on our FAQ page here.
We have also added our own map of Filey here.
Hope that helps.
Best regards, The ProVisualizer Team.
|
Complete |
| 27 Mar 2019 |
I love your program, but just lately when I'm plotting a course I get a message that rendering
has failed and the program drops out. I have about 6 courses on file, should I delete some?
Will this help?
Answer: Thanks very much for your feedback. You are not the first to report this issue.
There is no need to delete any of your courses. The website can easily handle hundreds of courses.
The problem you are seeing is something to do with the timing of operations in the graphics library.
We haven't yet been able to work out exactly what causes it, but it seems to occur mainly when you
click the buttons too quickly causing it to start the next operation before it has fully completed the
previous operation. We are looking into it to see if there is any way we can block it from starting the
next operation before it has completed the previous operation, but it's complicated and it might not
be possible to make it 100% bullet proof. In the meantime, the best advice is to give it a couple of
seconds to complete each operation before clicking the next button.
Hope that helps and we will continue trying to find a more robust solution.
Best regards, The ProVisualizer Team.
|
In Progress |
| 18 Feb 2019 |
I'm doing the courses for my son, and he tends to have to play longer tees than his age.
However when I start marking the 2D planner hole by hole, including targets, I sometimes get
a par 6 for what is in fact a very long par 5. How do I change this to the course actual pars?
Answer: Thanks for your message. It's good to hear that you are using the site this way.
Unfortunately there is no way to override the pars, as these are calculated based on the number of
targets that you define on each hole. The only way to change a par 6 to a par 5 is to remove one
of the targets. However, we think there is no reason why your plan should have exactly the same par
as the official scorecard. We think if you want to play a long par 5 as a par 6, or a long par 4 as a
par 5, then there is nothing wrong with that. Therefore, we would recommend going with the
calculated pars, as this will represent the most realistic target score on each hole.
Hope that makes sense.
Best regards, The ProVisualizer Team.
|
Not Possible |
| 3 Jan 2019 |
Hi, I recently had to re-install Windows on my computer because of a hard disk crash and even though
I had a bookmarks backup from my Chrome browser I can no longer find my courses under HTTP that
I have saved over 3 or 4 years. Is there any way to find them?
Answer: For each course:
- Click on the bookmark in Chrome.
- Click on "2D Planner".
- Click "Save As".
Your courses will then be restored under "My Courses".
If you no longer have the individual courses bookmarked in Chrome, please submit another feedback
with your email address. We should be able to recover your courses from our logs provided you have
clicked the "Link" button at least once for each course under "My Courses".
Hopefully the instructions above are enough, but please get in contact if you have any trouble.
Best regards, The ProVisualizer Team.
|
See Answer |
| 20 Nov 2018 |
Error occurred while rendering, rendering stopped. Please advise???
Answer: It's difficult to know what the problem might be without more information.
We have occasionally seen rendering errors if we click a button before the page is fully loaded.
Therefore, the first suggestion would be to wait a few seconds before clicking any buttons when the
page is loading. If this doesn't help, please submit another feedback describing the circumstances
of the error in as much detail as possible, and we will investigate further.
Best regards, The ProVisualizer Team.
|
More Details Required |
| 19 Nov 2018 |
OMG! What started out as a decision to upgrade my clubs (irons), lead me to perform statistical analysis,
which got me to thinking about writing an article for my professional organization, that resulted in me
stumbling across your site. To my surprise, a course that has victimized me and my partners (only to have
us return for more punishment) was in your list ... Tobacco Road, Sanford NC. Amazing!!!
I hope to obtain permission to use pics and data from your site in my paper. Reginald
Answer: Yes, of course, you are definitely welcome to use pics and data from our site in your article.
We only ask that you provide a link back to our site from your article, and also send us a link to your
article when it is published.
Best regards, The ProVisualizer Team.
|
Yes |
| 11 Oct 2018 |
Hi, Do you have a search feature - I can't seem to find it. Love your site by the way. Thanks.
Answer: Yes, you can either search by location on our Global Map or alphabetically on our A to Z listing.
If we don't already have the course you are looking for, let us know via this feedback page and we will
add it to the site as fast as we can.
Best regards, The ProVisualizer Team.
|
Complete |
| 12 Sep 2018 |
Viewing the course links on an iphone is working great.
Really like how the auto rotation of the holes is looking.
Wondering if there is a way to hide the upper address bar and bottom bar in safari.
Usually, that address bar at the top is minimized and the bottom bar is hidden as you scroll down a webpage.
Wondering if there is a way to hide these items while viewing/using the provisualizer page during a round.
Sad to see them eating up so much of the screen real estate.
Thanks for the tool!
Answer: We have added a full screen (FS) button to the Mobile Planner just above the zoom-in (+) button.
This works on Android but unfortunately full screen mode is not currently supported directly in Safari.
To view the page full screen in Safari, you have to click the "Go To" icon (square with arrow pointing out)
then click "Add to Home Page". You can then click the icon on your home page to view the web-page in
full screen mode.
Hope that makes sense, but please let us know if you have any further feedback.
Best regards, The ProVisualizer Team.
|
Complete |
| 10 Jul 2018 |
I just input the routing [2D Planner] for Burntisland as I did not see it had been done anywhere
previously. How do I ensure that my work is saved.... or in other words when will a url such as:
https://www.provisualizer.com/courses/burntisland.php be created for public access?
Answer: We don't allow users to publish directly to the ProVisualizer site because we would end up
with dozens of different versions of each course, and many of them would inevitably be incomplete
or inaccurate, which wouldn't be very helpful.
Instead, if you know of a really good course that deserves to be on the site, then please let us know
via the feedback box above. We will then map it as accurately as we can based on the official scorecard
and maps on the club website. This ensures that every course on ProVisualizer is mapped to the same
high standard and is regularly updated whenever new satellite imagery becomes available.
We have added Burntisland here.
Alternatively, if you go to "My Courses" and click the "Link" button, it will generate a course guide.
You can then either send the course guide directly to your friends by copying and pasting the URL
into an email, or you can make the guide more widely available by publishing it to a social media
site or discussion forum.
If you wish, you could also start your own website with guides for all the courses you have mapped.
Your website would then show up in search results, so the general public would be able to find
and view your courses almost as easily as if they were on the ProVisualizer site.
Hope that makes sense, but please let us know if you have any further feedback.
Best regards, The ProVisualizer Team.
|
Publishing directly to ProVisualizer not allowed |
| 4 Jun 2018 |
I have been using your system for quite a while now, but I see you have changed the mapping software
and I wonder why? I find it's not as good because sometimes I can't find golf courses so I search for
them by using the MAP option on Google maps.
Answer: Unfortunately Google imposed a massive price increase from $0.50 per 1000 maps to $7.00.
Therefore, we were unable to continue offering free Google maps and we had to look for an alternative.
A few features were missing when we first switched, but we have now added a drop-down to all the
maps to allow you to switch between satellite, terrain and map view.
We are still learning how to get the best out of the new maps, and we will continue making further
improvements over the next few weeks and months.
Best regards, The ProVisualizer Team.
|
Complete |
| 31 May 2018 |
What happened to the "Show Dispersion" button on the 2D Planner?
Answer: This was temporarily removed while we switched from Google maps to Cesium.
Apologies for the delay getting it working, but it has now been restored.
Best regards, The ProVisualizer Team.
|
Complete |
| 27 May 2018 |
New provisualizer version produces this error:
Error constructing CesiumWidget.
Visit http://get.webgl.org to verify that your web browser and hardware support WebGL.
Consider trying a different web browser or updating your video drivers.
Would it be possible to use somehow the old version that works on every Browser/OS?
Answer: Unfortunately, Google have increased the price of maps from $0.50 per 1000 to $7.00 per 1000
so we can no longer afford to provide free Google maps as used in the old version.
We chose to switch to Cesium because it is open source (so should always be free) and is based on WebGLwhich is widely supported by most modern browsers, operating systems and graphics cards.
Unfortunately it sounds like something in your system doesn't support WebGL.
The only thing we can suggest is to follow the link in the error message to identify the cause of the problem.
If it's an issue with the browser, you might be able to fix it simply by switching to another browser.
Hope that helps.
Best regards, The ProVisualizer Team.
|
Not Possible Google Maps Too Expensive |
| 26 May 2018 |
Lines and circles have disappeared from the 2D Planner on Firefox, Qupzilla, Chromium and Opera running
on xubuntu 32 bits, in the new version of the web. If some special settings are required to run the new
version, it would be really helpful to find them published in the web support.
Answer: The new maps are based on Cesium, which should work on any system that supports WebGL.
Unfortunately, it sounds like your system might not fully support all the WebGL features used on ProVisualizer.
As you have tried multiple browsers, the most likely cause is either your operating system or graphics card.
We would like to investigate in detail, but we cannot reproduce the problem on the machines we have available.
Therefore, the only thing we can suggest is to raise the issue on the Cesium Forum.
Hopefully someone on the forum will have experience of your system and know how to fix it.
If you hit F12 in your browser you might be able to get a detailed error message.
If you post a detailed error message to the forum, we can then examine our code and possibly provide a fix.
Hope that helps.
Best regards, The ProVisualizer Team.
|
Raise Issue in Cesium Forum |
| 25 May 2018 |
Why are you no longer using Google maps?
Answer: Unfortunately Google decided to increase the price of maps from $0.50 per 1000 to $7.00 per 1000.
This meant we could no longer afford to provide free Google maps, and we had to find an alternative.
We chose Cesium because it is open source (so should always be free) and based on WebGL, which is
widely supported by most modern browsers, operating systems and graphics cards.
Hopefully it should be a smooth transition for most of you, but if you have any trouble, please let us know.
Best regards, The ProVisualizer Team.
|
Complete |
| 30 Nov 2017 |
While using the mobile planner on an iPhone (portrait view), I find myself wanting to align the length
of each hole vertically to maximize the information on the screen. Presently each hole is presented
with north always upward. Would it be possible to have the ability to rotate the map in the mobile planner
window? Or better yet could each view of an individual hole default to have the pin position at the top
of the view and the tee position at the bottom of the view? Thanks!
Answer: The 2D Google map on the Mobile Planner does not support rotation.
However, we have added a "3D" button so you can now view each hole in 3D from behind the tee looking
forward towards the green, as requested. We have also added a "Shot" button so you can quickly move
forward to the next shot in 3D mode, or move the circles to the next target in 2D mode. We also added
more information above the map so you can now see the exact length of each shot.
Hope that's OK, but please let us know if you have any further feedback.
Best regards, The ProVisualizer Team.
|
Complete |
| 13 Nov 2017 |
Can I use the mobile planner to set the pin position on the course using GPS from my phone?
Answer: The mobile planner does not allow you to set the pin position using GPS on the course.
The best approach is to map the course with the pin in the centre of the green.
You can then add or subtract a few yards to adjust for the exact pin position on the day.
If you wish, you can verify the accuracy of the satellite imagery by pressing the GPS button
and then switching back to the map and checking the blue marker is where you are actually standing.
If possible, we would also recommend investing in a laser range finder. Lasers are much more accurate
and reliable than GPS, and will allow you to play with much more confidence when going for the pin.
A laser will also help you learn exactly how far you hit each club in various conditions, which will
really help you improve in the long run.
Hope that makes sense, but please let us know if you have any further feedback.
Best regards, The ProVisualizer Team.
|
Not Possible |
| 21 Oct 2017 |
It would be really good to add the elevation data of tees, fairways (driver fall point) and greens.
In Spain you can get them from ign.es. This would be particularly useful on courses like Valderrama.
I guess that there will be similar websites in other countries. Download from here.
Answer: The best way to get accurate elevation data is to use the "3D Fly-Over in Google Earth" option.
- Go to the course home page, e.g. Valderrama.
- Scroll down to "3D Fly-Over in Google Earth" and click "View Course in Google Earth".
- Open the KML file in Google Earth.
- Make sure "3D Buildings" and "Terrain" are selected in the "Layers" on the left hand side.
- Double-click "Complete Tour" or "Hole 1", "Hole 2", etc. to go straight to a specific hole.
- Pause the fly-over when you get to the view you want.
- Hover the mouse over any point on the ground.
- The elevation is shown in the information bar at the bottom.
This is much more accurate than the freely available national elevation datasets, which are typically
smoothed to a 5 or 10 metre grid at best, and are not really accurate enough for relatively small features
such as tees and greens.
Hope that's OK, but please let us know if you have any further feedback.
Best regards, The ProVisualizer Team.
|
Use 3D Fly-Over in Google Earth |
| 16 Mar 2017 |
On Windows desktop, when I touch a target it shows the shot length and club selection
but not so on my Android tablet.
Answer: Unfortunately this feature relies on having a mouse, so only works on desktops and laptops.
On tablets and smartphones, the only way to work out the distance is to read it off from the circles.
This takes a bit of practise, but it is really quick and intuitive once you get the hang of it.
Use the "Next Shot" button to see the distance to/from each of your targets.
The Mobile Planner is also a good way to view pre-mapped courses on tablets and smartphones.
This shows the length of each hole above the map and makes better use of the limited screen space.
Click the check box in the top right corner to add more detailed circles and a "Shot" button.
We will think about whether it is possible to improve the 2D Planner and Mobile Planner so they give
more information regarding the length of each shot. There is limited screen space but we agree it would
be an improvement if more information was displayed.
Please check back in a few weeks for updates.
Best regards, The ProVisualizer Team.
Update: We have modified the 2D Planner so it displays extra information on the panel on the right.
When you click "Next Hole" it displays the par and length of the hole, plus the length of each shot in brackets.
When you click "Next Shot" it then gives you the detailed club information for each shot.
This makes it possible to see the information on devices that don't support the mouse-over function.
We hope it will also be a useful addition on desktops and laptops.
We decided to leave the Mobile Planner as it is because most smartphones don't have enough screen space
to display any more information. Hope that's OK.
Please let us know if you have any further feedback.
Best Regards, The ProVisualizer Team.
|
Complete |
| 16 Mar 2017 |
When I search for a course using the "Find on Map" button on the 2D Planner it doesn't load the course.
Answer: The "Find on Map" button is just to help you find and map your own courses.
To view a pre-mapped course, you can either go to Pro Calendar for PGA and European Tour courses
or Global Map for the complete list of all the pre-mapped courses available on the site.
If you can't find the course you are looking for, let us know and we will add it as soon as we can!
|
Works As Intended |
| 18 Jul 2016 |
Can you add calculated yardage from elevation change between point A and B?
Google Earth provides altitude, and the formula could be 1 yard per 1 yard change in elevation.
There's a lot of downhill and uphill shots that us golfers face during a round, it'd result in
lower scores if we had the right yardage to all those shots.
Answer: Thanks very much for your feedback. We would love to be able to offer this feature but
unfortunately we only get 2500 free elevation requests per day, which is not enough to support shot-by-shot
elevation calculations. Therefore, the best solution is to export your course to Google Earth and use the
elevation feature in Google Earth to see the elevation at any point on the course simply by hovering
over the point with your mouse.
To export your course to Google Earth, follow these steps:
- Map your course using the 2D Planner and click "Save As" to save it to "My Courses".
- Go to "My Courses" and click the "KML" button.
- This will generate a KML file containing a complete tour plus separate fly-overs for each hole.
- To go quickly to one of the holes, double-click the fly-over for that hole.
- You can then either watch the fly-over, or pause the fly-over and manually pan/zoom the map.
- To see the elevation at any point, simply hover the mouse over the required location.
- The elevation is shown in the information bar at the bottom of the screen.
- By comparing the elevation at different points, you can see how much uphill or downhill each shot is.
If you don't already have Google Earth installed, it is available for free download here.
We thoroughly recommend trying it, as the high-definition coverage is increasing all the time and many
courses have extremely accurate and realistic 3D buildings and trees that can really help you to visualize
your shots and plan the best strategy.
Please let us know if you have any further feedback.
Best regards, The ProVisualizer Team.
|
Export to Google Earth |
| 14 Jan 2016 |
Guys I am a college coach. This link shows someone explaining what we are doing: Coaching Video.
We would love to do all of this in one place on your site and the only thing that we would need is to be able
to draw a line across a landing zone and see how wide it is at any spot.
Answer: Thanks very much for your feedback. It's great to hear that you are using the site in this way!
We have added a "Measure Distance" button to the 2D Planner to allow you to measure the distance between
any two points on the course. Note that you can also use the "Next Shot" button to center the white circles on
each of your targets to see the size of each target zone and how much margin there is to nearby hazards.
Please let us know if the new button meets your requirements.
Best regards, The ProVisualizer Team.
|
Complete |
| 17 Sep 2015 |
I am having problems with the 3D Planner in Chrome. I have followed Google's fixes and have had no resolution.Please Advise.
Answer: Due to security concerns, the latest version of Chrome no longer supports the Netscape Plugin API.
Unfortunately, this means that the Google Earth Plugin used by the 3D Planner no longer works in Chrome.
Lots of people have complained to Google about this because there are lots of websites built around the plugin.
However, Google say that the security issues are too serious and they have no choice but to abandon the NPAPI.
We expect that Google will announce a replacement for the plugin shortly, but we don't know when this might be.
As soon as the replacement is available, we will switch over, but there is nothing we can do just yet.
In the meantime, the only option is to use an alternative browser such as Firefox to run the 3D Planner.
You can transfer your course from Chrome to Firefox using the "Link" button on "My Courses".
Hope that is OK.
Best regards, The ProVisualizer Team.
|
Workaround Use Firefox |
| 14 Jul 2015 |
Could you provide the option to rotate the map in the yardage chart in order to fit the hole in eitherportrait or landscape orientation?
Answer: There is no built-in rotate in the current Google Maps API, and applying a CSS rotate transformation
causes the map to lose sharpness and also causes the map to move in the wrong direction when dragging.
Therefore, rather than adding an option to rotate the map within the chart, we added an option to rotate the
header and footer around the map. We also added an option to allow you to rotate the text within the header
and footer. Together, these options should give you the flexibility to optimize the position and orientation
of the header and footer on every hole.
Please let us know if you have any further comments or questions.
Best regards, The ProVisualizer Team.
|
Complete |
| 24 Oct 2013 |
Could you provide the option to use metres instead of yards? |
Complete |